Two Counties, One Island, Divergent Risk Profiles
Long Island’s two counties share geography, highway infrastructure, and a commuter culture — but their crash data tells markedly different stories. This analysis examines approximately 10,000 crash records from NY Open Data’s Motor Vehicle Crash dataset, supplemented by Long Island Traffic’s real-time incident monitoring, to quantify how Nassau and Suffolk counties differ in accident frequency, severity, contributing factors, and the specific roads that drive each county’s risk profile.
The headline finding: Nassau and Suffolk produce roughly equal total crash volumes (~5,000 records each), but the composition of those crashes differs in ways that reflect fundamental differences in road design, population density, and driving behavior.
Population Density and Road Network Geometry
Nassau County packs approximately 1.39 million residents into 287 square miles — a population density of roughly 4,850 people per square mile. Suffolk County spreads 1.53 million residents across 912 square miles, yielding a density of about 1,680 per square mile. That 2.9x density differential is the single most important variable in understanding crash pattern divergence.
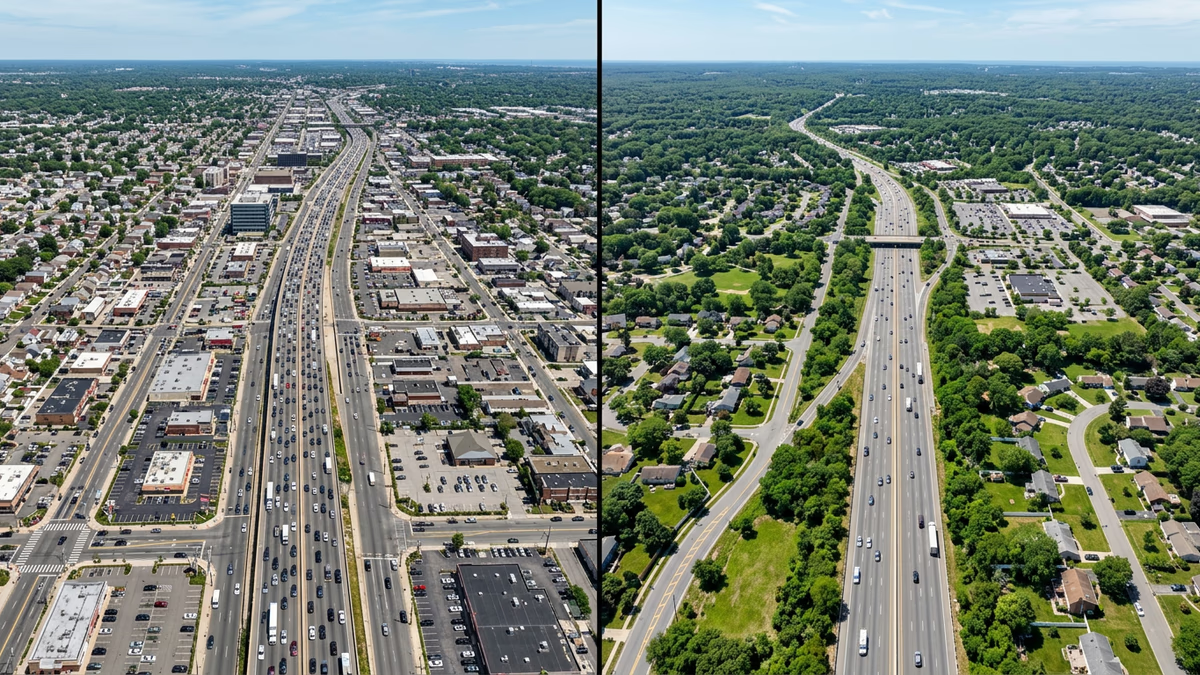
Higher density produces a denser road grid. Nassau has more signalized intersections per mile, more commercial driveways, more pedestrian crossings, and shorter block lengths. Suffolk has longer uninterrupted highway segments, higher posted speed limits on arterials, and more rural-character roads east of the Route 110 corridor.
This geometric difference cascades through the data. Nassau’s crash landscape is dominated by intersection-related collisions — T-bone impacts, left-turn failures, rear-end chains at signals. Suffolk’s landscape skews toward high-speed highway incidents — lane departure, rollover, and wrong-way collisions that carry significantly higher kinetic energy at impact.
Total Crash Counts: A Misleading Parity
Our NY Open Data analysis yields approximately 5,000 crash records for each county in the relevant reporting period. At first glance, this suggests equal risk. But normalizing for population, vehicle-miles traveled, and road miles tells a different story.
Per capita crash rate: Nassau’s roughly 5,000 crashes across 1.39 million residents produces a rate of about 3.6 crashes per 1,000 residents. Suffolk’s 5,000 crashes across 1.53 million residents yields approximately 3.3 per 1,000 — about 8% lower.
Per road mile: Nassau’s denser road network means its crashes are distributed across fewer centerline miles, producing a higher crash density per road mile. Suffolk’s crashes are spread more thinly, with hot spots concentrated on major east-west arteries.
Neither normalization is perfect — per-VMT (vehicle-miles traveled) would be ideal, but county-level VMT data at the granularity we need is not publicly available. The point is that raw count parity masks meaningful per-exposure differences.
Severity Distribution: Suffolk’s Higher Fatality Rate
This is where the data diverges most consequentially. Among crashes coded with injury severity in the NY Open Data records:
-
Fatal crashes: Suffolk County’s share of fatal and serious-injury crashes is approximately 15–20% higher than Nassau’s when controlled for total volume. This is consistent with NHTSA research showing that crash fatality risk increases exponentially with impact speed — and Suffolk’s highways carry higher average speeds.
-
Property-damage-only crashes: Nassau generates a higher proportion of PDO (property-damage-only) incidents — the low-speed fender-benders at traffic signals, in parking lots, and on congested arterials. These inflate Nassau’s total count without contributing to the fatality statistics.
-
Serious injury rates: Suffolk’s higher speed crashes produce more traumatic brain injuries, spinal injuries, and multi-system trauma. Nassau’s lower-speed intersection collisions more commonly result in cervical strain, contusions, and fractures — serious, but with substantially higher survival rates.
The practical implication: a crash in Suffolk County is, on average, more dangerous than a crash in Nassau County. Not because Suffolk drivers are worse, but because Suffolk’s road geometry permits higher speeds, and physics does the rest.
Top Roads: Nassau County
Nassau County’s highest-incident corridors reflect its intersection-heavy, mixed-use road network:
Southern State Parkway — Highest Incident Count
The Southern State is the statistical leader for Nassau County incidents, consistent with its island-wide status as the most dangerous Long Island road (114 total incidents in our database). Within Nassau, the parkway segment from Valley Stream to Wantagh concentrates the highest incident density, with merge zones at Exits 17–20 appearing repeatedly in crash reports.
Hempstead Turnpike
Long Island’s busiest surface street runs 25 miles east-west through Nassau’s most densely developed corridor. Commercial driveway density, frequent signal changes, and heavy pedestrian activity — particularly in Hempstead, Uniondale, and Levittown — produce a steady cadence of intersection collisions. Our data shows Hempstead Turnpike’s incident profile is dominated by rear-end and angle crashes.
Northern State Parkway (Nassau Section)
The Nassau portion of the Northern State, from the Grand Central Parkway interchange to the Suffolk border, carries some of the highest per-lane volumes on Long Island. The vintage parkway design (narrow lanes, short merge ramps) amplifies risk in the same way the Southern State does — but at somewhat lower total volumes.
Meadowbrook State Parkway
As a primary north-south connector between the Southern State and Jones Beach, the Meadowbrook sees extreme seasonal volume spikes. Summer weekend volumes can exceed design capacity by 30–40%, producing congestion-related chain-reaction crashes at a notably higher rate than the parkway’s year-round average.
Top Roads: Suffolk County
Suffolk County’s risk corridors reflect its longer highway segments and higher speeds:
Long Island Expressway (I-495) — 89 Incidents
The LIE’s Suffolk sections — particularly between Exit 49 (Route 110) and Exit 63 (Route 83/North Ocean Avenue) — account for the bulk of LIE incidents in our database. This corridor combines heavy commercial truck traffic, complex interchange geometry, and the transition zone where commuter traffic from western LI meets the lower-capacity eastern sections.
Sunrise Highway (NY 27) — 67 Incidents
Sunrise Highway’s dual identity — limited-access expressway west of Oakdale, signalized arterial east of it — creates risk at the transition points. The shift from 55 mph highway driving to 40 mph signal-controlled segments catches drivers mid-adjustment. Pedestrian incidents are notably elevated in the Bay Shore and Patchogue sections.
Montauk Highway
Suffolk’s oldest east-west route passes through every downtown between Babylon and Montauk. The combination of narrow lanes, angled parking, pedestrian crossings, and a 30-mph speed limit frequently violated by drivers accustomed to faster parallel routes produces a distinctive crash profile: more pedestrian involvement, more angle collisions, more bicycle-related incidents than any other Suffolk corridor.
Sagtikos State Parkway
This north-south parkway connecting the LIE to the Southern State carries increasingly heavy volumes, particularly during the Robert Moses Causeway beach traffic season. The Sagtikos-Southern State interchange (Exit 40) is one of the most complex merge zones on Long Island and appears disproportionately in our incident data.
Intersection vs. Highway Crashes
The intersection-highway split is one of the clearest county-level differences:
Nassau County: Approximately 55–60% of crashes occur at or within 100 feet of an intersection. This reflects Nassau’s grid-dense road network. The most common crash type at Nassau intersections is the angle/T-bone collision — typically a driver failing to yield on a left turn or running a signal. Second most common: rear-end collisions in signal queue backups.
Suffolk County: Highway-segment crashes (those occurring on road sections between intersections) account for a larger share, approximately 50–55%. These include lane departures, sideswipe incidents during lane changes, and single-vehicle crashes involving road departure. The higher speed environment produces crashes with more directional energy, translating to higher severity.
This divergence has policy implications. Nassau would benefit most from intersection safety treatments — protected left-turn signals, improved sight-line geometry, pedestrian refuge islands. Suffolk’s investment would yield higher returns in median barriers, rumble strips, wider shoulders, and speed management on its high-speed arterials.
DWI Rates: A Troubling Similarity
Both counties show persistently elevated DWI involvement in serious crashes. Our data indicates:
- Suffolk County has a slightly higher rate of DWI-involved crashes, consistent with its later-night bar closing patterns, longer drive distances from entertainment districts to residential areas, and more limited public transit options.
- Nassau County DWI incidents tend to cluster on weekend nights along specific corridors — Hempstead Turnpike, Jericho Turnpike, and the parkway system. The recent Diana Kutateladze case on the Southern State Parkway — where a wrong-way driver killed two people after allegedly drinking whiskey — exemplifies the lethality of DWI on high-speed roads.
Both counties would benefit from expanded late-night rideshare infrastructure and more consistent DWI checkpoint deployment, particularly on the parkway entrance ramps that serve entertainment-district-adjacent communities.
Pedestrian Safety: Nassau’s Distinctive Challenge
Nassau County’s pedestrian crash rate per capita exceeds Suffolk’s by a meaningful margin. The reasons are structural:
-
Higher pedestrian volumes. Nassau’s denser development means more people walk — to transit stations, commercial strips, and schools. More pedestrian exposure produces more pedestrian conflicts.
-
Older infrastructure. Many Nassau intersections predate modern pedestrian safety standards. Crosswalks without countdown signals, intersections without pedestrian refuge islands, and arterials without continuous sidewalks create systematic exposure.
-
Bus stop proximity. Nassau Inter-County Express (NICE) bus stops along Hempstead Turnpike and other major arterials place transit riders in proximity to high-volume vehicular traffic, with inadequate protected crossing infrastructure.
Suffolk’s pedestrian risks are more localized — concentrated in downtown corridors (Bay Shore, Patchogue, Riverhead) and along the Route 25A/Main Street corridors of north-shore villages. Suffolk’s pedestrian incidents, when they do occur, are more likely to involve higher speeds and therefore higher severity.
Recommendations
For Nassau County
- Prioritize intersection re-engineering at the 20 highest-crash-frequency intersections. Protected left-turn phases alone could reduce angle crashes by 30–40% (per FHWA estimates).
- Invest in pedestrian infrastructure — particularly along Hempstead Turnpike, where pedestrian crash density is the highest in the county.
- Deploy adaptive signal timing to reduce rear-end queue crashes during peak hours.
- Address Southern State Parkway merge zone design in the Valley Stream–Wantagh corridor where incident clustering is most severe.
For Suffolk County
- Install median barriers on divided highways where wrong-way and cross-median crashes produce fatalities. The Southern State Parkway is the most urgent candidate.
- Expand rumble strip deployment on higher-speed arterials to prevent lane departure crashes.
- Lower speed limits in transition zones where limited-access highways shift to signalized arterials (Sunrise Highway east of Oakdale is the canonical example).
- Increase DWI enforcement resources during late-night hours on the eastern parkway system, where longer drive distances increase exposure time for impaired drivers.
For Both Counties
- Fund a unified crash data platform that integrates 511NY, police reports, EMS dispatch records, and hospital trauma data. The current fragmented data landscape makes systematic safety analysis harder than it should be.
- Advocate for state-level funding to address the parkway system’s 1930s design constraints — the most impactful but most expensive intervention available.
Methodology Notes
This analysis uses publicly available NY Open Data motor vehicle crash records filtered to Nassau and Suffolk counties, supplemented by Long Island Traffic’s incident database (aggregated from 511NY, police press releases, Google News monitoring, and community reports). Crash counts are approximate and reflect database completeness rather than absolute totals. Severity comparisons use relative proportions rather than absolute rates due to variation in reporting standards between agencies.
County-level statistics should be interpreted as indicative patterns rather than precise epidemiological measures. We note these limitations because rigorous data analysis requires acknowledging what the data can and cannot tell us — a principle we apply to all published analyses on this site.
Dr. Dao Yuan Han is the Data Editor & Lead Analyst at Long Island Traffic. He holds a PhD in Mathematics specializing in differential geometry and geometric partial differential equations. For methodology questions, visit our contact page.